{elliot.js} near real time graphing

Welcome to {elliot.js}

{elliot.js} was created to fill a need for graphing near real time events in various web projects. It has been used to produce graphs for log analytics, customer actions, monitoring and similar services.

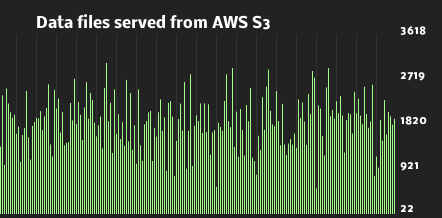
Special requirements? {elliot.js} is highly configurable. You can easily change background colors, bar sizes, colors, fonts, update frequenzy etc. Have a look at our examples for some inspiration.

{elliot.js} is open source! It is licenced under Apache License version 2.0. You can fetch or fork the code at GitHub.

{elliot.js} relies on the HTML 5 <canvas> and regular JavaScript. It is widely supported, both on mobile platforms and desktop browsers. Have a look at http://caniuse.com/#feat=canvas for more detailed information about <canvas> browser support.

Feature list

Here are some of {elliot.js}'s highlights:

Usage

It is dead easy to integrate {elliot.js} into your applications. Here's code for the graph "Cars inside the city gates".

    <canvas id='myCanvas' width='700' height='200'>
      Text shown to browsers that does not support HTML5
    </canvas>

    <script type="text/javascript">
    var elliot = new Elliot('myCanvas', {
        'general': {
          'background': '#2F2C2B', // Graph background color
          'title': 'Cars inside the city gates', // Graph title
          'titleFont': 'Nobile', // Font name for the title
          'titleFontSize': 11, // Graph title font size
          'titleFontColor': '#ffffff', // Graph title font color
          'yAxisTitle': 'Cars', // Y axis title
          'yAxisFont': 'Nobile', // Font name for the Y axis
          'yAxisFontSize': 10, // Y axis font size
          'yAxisFontColor': '#ffffff', // Y axis font color
          'yAxisNumTicks': 7, // How many ticks should be shown
          'yAxisTickFontSize': 8, // Y axis tick font size
          'logLevel': 'INFO', // Set log level
          'stickyScaling': false // Scale graph using data for
                                 // the whole session (rather than
                                 // the currently displayed data)
        },
        'barGraph': {
          'markerPosition': 20, // Show marker every n bars. 0 == off
          'updateFrequency': 500, // Graph update frequenzy
          'incrementalValues': true, // Should values be incremental?
          'barBackgroundColor': '#2F2C2B', // Color of the bars
          'barColor': '#ff6060', // Color of data in the bars
          'markerColor': '#333333', // Color of the marker bars
          'barWidth': 3, // How many px should the bars be
          'barSpacing': 1, // Pixels between the bars
        }
      });
    </script>
  

As you might have noticed. We initiate {elliot.js} by calling Elliot() which takes two arguments; the canvas tag id and a configuration object. The next thing we need to do is to add data to the graph. This is done with a simple JavaScript call to elliot.add(float) or elliot.remove(float). In the configuration above, we set incrementalValues to true, which means that {elliot.js} will keep track of the current value all the time and all you need to do is to adjust it with the add() and remove() functions. Here's an example:

    elliot.add(10);
    elliot.remove(5);
  
Boring example? Indeed! Let's try to get some continuous data inserted into {elliot.js}.
    // Add some initial data before the loop
    elliot.add(Math.floor(2500000));

    // Create an infinite loop which loops every second
    var dataInterval = setInterval(function () {
      // Add some data
      elliot.add(Math.floor((Math.random()*2200)+1));

      // And remove some other data (which is
      // likely to be smaller than the data added)
      elliot.remove(Math.floor((Math.random()*1500)+1));
    }, 1000);
  
More documentation can be found in the bundled documentation.

Examples


Downloads

Fetch your fresh copy of {elliot.js} here:

Version Zip Gzipped
0.2.0 .zip .tar.gz
0.1.0 .zip .tar.gz

Contact details

If you have any questions, please send an e-mail to sebastian.dahlgren@gmail.com or send a tweet to @sebdah to get in touch with me. I will answer your question as soon as possible.